SQL Server Wait Types – Trace and Tune Database Performance Issues
It is a big challenge for database administrators to trace performance issues, tune and maintain database server effectively. I receive many queries regarding database performance issues, some issues come after migration, some issues are adhoc and some when database grows after a period. Primary objective for a DBA is to trace and tune performance issues periodically. Generate regular reports, compare new statistics with old statistics and find out the improvement possibilities. In some cases tunings are possible but in some scenarios tunings are not possible and you have to upgrade your hardware to resolve the problems. Here we are going to find out wait statistics to trace performance issues.
Normally, front end users submit their requests and expects that they get output instantly but scenario is different behind the server. That request goes from front end application to back-end server and processes data from database and sends the output to end users. Now, this request involves processing time, wait time, idle time and total response time etc. You can understand in a large environment where thousands of users are involved requesting different data from server, how can be the actual situation.
So, here we are going to discuss about couple of DMVs which provides historical and real time information about bottlenecks. SQL Server 2012 has 649 wait types, out of which few are very useful to find the performance issues and few are less useful depending on scenarios and situations. There are different categories of dynamic management objects like sys.dm_exec_XX, sys.dm_os_XX, sys.dm_tran_XX, sys.dm_db_XX, sys.dm_io_XX etc. where XX replaces full name of DMOs.
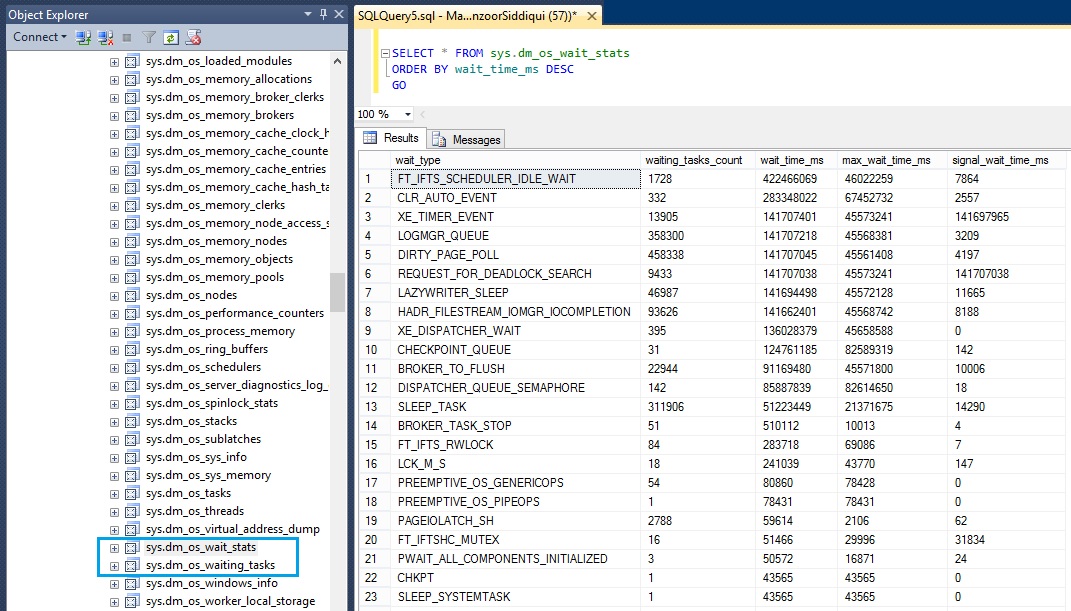
You can check the DMVs list in Object Explorer –> go to your database –> Views –> System Views.
Here we are going to discuss two dynamic management views (DMVs).
– sys.dm_os_wait_stats
– sys.dm_os_waititng_tasks
sys.dm_os_wait_stats
This dynamic management view (DMV) provides historical information about how long a task was waiting for particular wait type after last statistics reset or database instance restarted.
You need to collect lots of statistics over a period of time to come to any conclusion for issues with your historical data.
SELECT * FROM sys.dm_os_wait_stats
ORDER BY wait_time_ms DESC
GO
This DMV has five columns as:
wait_type:
It provides name of the wait type, it is categorised into resource waits, queue waits and external waits.
waiting_tasks_count:
It indicates how frequently the wait is occurring and provides number of waits and counter value is incremental. Higher counts help to trace issues easily.
wait_time_ms:
This is total wait time including signal_wait_time_ms. As soon as execution stops and task is waiting for resources, the value increases.
max_wait_time_ms:
It gives information about maximum wait time in milliseconds on particular wait type.
signal_wait_time_ms:
It indicates time duration between thread run request to running state.
You can reset the wait stats with below query.
DBCC SQLPERF('sys.dm_os_wait_stats', CLEAR)
sys.dm_os_waiting_tasks
This dynamic management view provides real time information about a task which is waiting for resource availability and is very useful to track the bottleneck. When a task is waiting for resource, it gets moved to waiting list and when resource is available the task is moved to running group and waits for execution request.
You can use this DMV when you observe server slowness or when query execution takes abnormal time.
SELECT *FROM sys.dm_os_waiting_tasks
ORDER BY wait_duration_ms DESC
GO
or you can join above query with sys.dm_exec_sessions and execute the same as shown below.
SELECT DES.login_name, DES.program_name, DES.client_interface_name,
OWT.wait_type, OWT.wait_duration_ms FROM sys.dm_os_waiting_tasks as OWT
INNER JOIN sys.dm_exec_sessions as DES
ON OWT.session_id = DES.session_id
WHERE DES.is_user_process = 1 AND OWT.wait_duration_ms > 10000
Above query uses sys.dm_os_waiting_tasks and sys.dm_exec_sessions DMVs and provides users tasks list which are waiting for more than 10 seconds.
As I already said there are 649 wait types in SQL Server 2012 so it is difficult to explain all wait types. I am listing here few wait types which are commonly traced.
CXPACKET:
CXPACKET wait type is observed when query uses parallelism. It does not indicate any bottleneck directly but indicates when a session is waiting for any synchronization and query is taking more than normal time. You need to check your queries for missing indexes and WHERE clause conditions.
SOS_SCHEDULER_YIELD:
When CPU utilization is high due to SQL Server at that time you can observe SOS_SCHEDULER_YIELD wait type and you need to investigate queries and other related parameters.
ASYNC_NETWORK_IO:
As the name suggests it is related with network related issues and may also relate to slow user applications so you need to check your large processing queries.
WRITELOG:
This wait type is observed when SQL Server is waiting to flush the logs to transaction log. It may indicate disk bottleneck or require to add more storage but before that you need to investigate further.
Wait stats is a huge topic and it is not possible to cover in a single post hence over the time remaining wait types and explanation will be published in detail.
Kindly note that you need VIEW SERVER STATE permission to use these DMVs.
CLICK HERE to watch live practical.
Reference: Manzoor Siddiqui [www.SQLServerLog.com]

