Identify Database Bottlenecks with Performance Monitor Counters

Performance monitor is a free tool provided by Microsoft windows and is very useful to analyse real time and historical performance information of your database servers and windows servers. So if you don’t have third party tool and you want to monitor performance of CPU, Disk, Memory or Database Server then this is one of the best tool for you because it is available absolutely free and easy to access as it comes in bundle with your Microsoft windows.
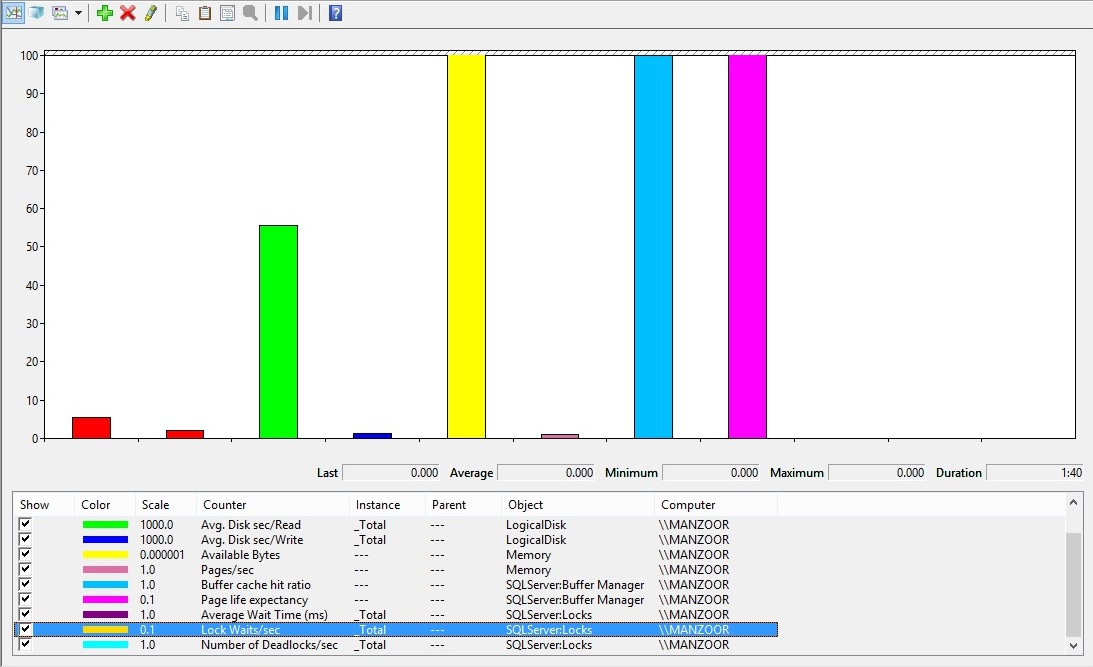
Figure 1: Histogram Bar
To access performance monitor you can navigate to Control Panel –> Administrative Tools –> Performance Monitor or you can also access it from windows Start Menu –> type perfmon.exe in Start search box and press Enter. It will open Performance Monitor window where you have to add counters by clicking green plus symbol (+) or right click on performance window and select Add counters… It will pop up add counters window where you can choose and add counters. You can highlight counter name and select Show description to understand the actual meaning and work of that counter.
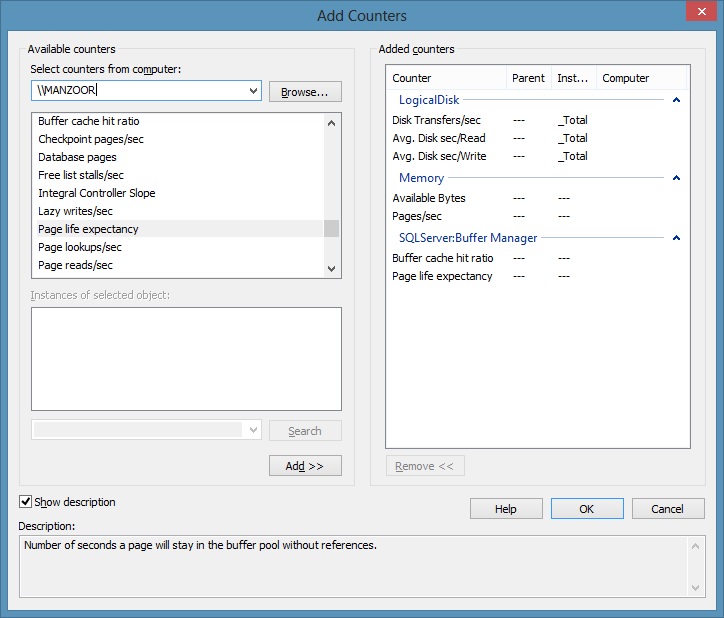
Figure 2: Add Counters
We can divide performance counters in four major category as CPU, Disk, Memory and SQL Server counters. You can change the graph type in different view format like Line, Histogram bar and Report. You have option to choose graph type by pressing Ctrl+G to switch between different views instantly. Below is a report view of counters.
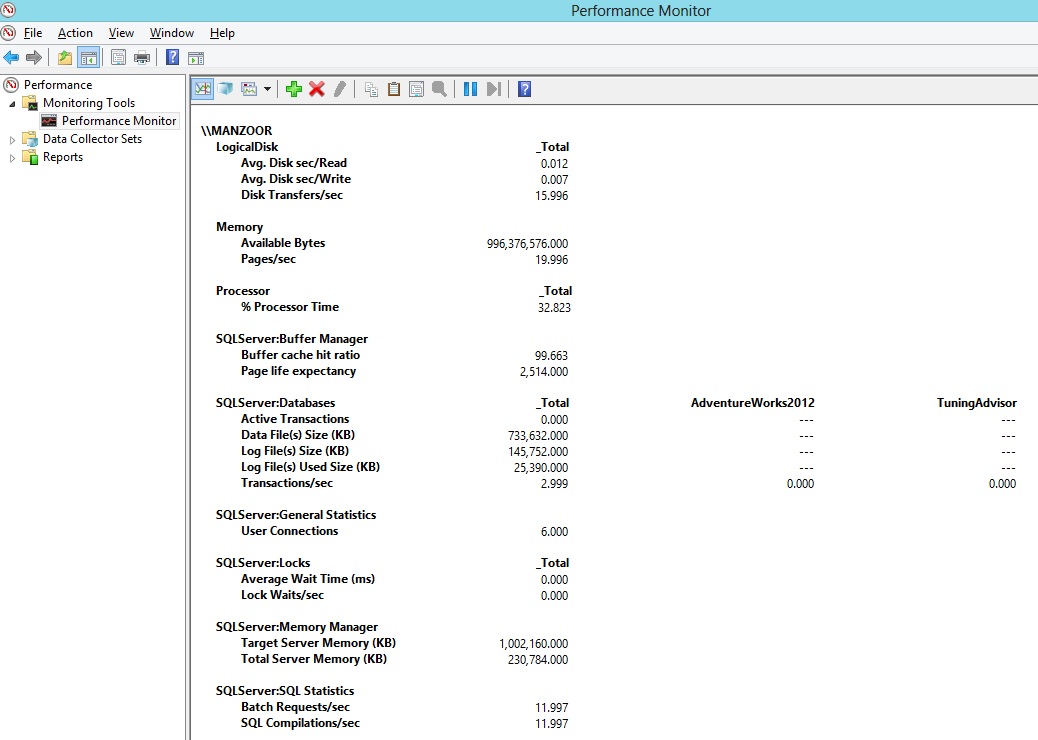
Figure 3: Report View
As there are hundreds of counters, we will discuss few important and commonly used counters for database server monitoring.
Buffer Cache Hit Ratio
You can describe it as percentage of pages that were found in the buffer pool without having to incur a read from disk. The ideal value for buffer cache hit ratio is anything above 98% and if it is above 90% then it can be considered as satisfactory and value below 90% may indicate slow database performance and increased I/O and you have to keep an eye on this counter and if required you can add more memory as it indicates memory bottlenecks.
This counter is available under SQLServer:Buffer Manager
Page Life Expectancy
It is described as number of seconds a page will stay in the buffer pool without references. Ideal value for this counter is 300 seconds which means page life expectancy with 300 seconds will keep pages for 300 seconds in memory before flushing it to disk. So 300/60=5 minutes, so if this counter drops below 5 minutes (300 seconds) it indicates SQL Server is facing memory bottleneck and you have to monitor it continuously and increase the memory accordingly.
This counter is available under SQLServer:Buffer Manager
Avg. Disk sec/Read
Avg. Disk sec/Read is the average time, in seconds, of a read of data from the disk. It measures how fast a disk responds when data is accessed from disk. Ideal value for this counter is anything below 10 ms and if latency is upto 30 ms then it is considered as fine. If you face this bottleneck then consider to use faster disk drives, use multiple controllers, keep log file (.ldf) on separate disk from primary and secondary data files (.mdf and .ndf files). In some cases you need to verify queries and tune it accordingly.
This counter is available under LogicalDisk.
Avg. Disk sec/Write
Avg. Disk sec/Write is the average time, in seconds, of a write of data to the disk. It measures how fast a disk responds when data is written to disk. Ideal value for this counter is anything below 10 ms and if latency is upto 30 ms then it is considered as fine. If you face this bottleneck then consider to use faster disk drives, use multiple controllers, keep log file (.ldf) on separate disk from primary and secondary data files (.mdf and .ndf files). In some cases you need to verify queries and tune it accordingly. You can ignore spikes which is coming sometime or rarely.
This counter is available under LogicalDisk.
Disk Transfers/sec
Disk Transfers/sec is the rate of read and write operations on the disk. It helps to identify I/O per second on logical disk. This counter should not exceed the capacity of your disk subsystem as per mentioned I/O per second. You have to refer disk avg. read time and disk avg. write time counters along with this counter to come to conclusion for I/O bottleneck.
This counter is available under LogicalDisk.
User Connections
This counter provides number of users connected to the SQL Server instance. As number of connections increases on the server, it specifies that server is getting busy however total user connections may or may not be same as number of users. A single user may have multiple connections and multiple users may have single connection depending upon scenarios. User connections may be three to four times as compared to worker threads. You have to monitor continuously this counter over the time to understand usage of your database server.
This counter is available under SQLServer:General Statistics.
% Processor Time
% Processor Time is the percentage of elapsed time that all of process threads used the processor to execution instructions. An instruction is the basic unit of execution in a computer, a thread is the object that executes instructions, and a process is the object created when a program is run. Code executed to handle some hardware interrupts and trap conditions are included in this count. Ideal value for % processor time is below 50% for best performance however if it is under 80% then it can be consider as satisfactory but if it is exceeding 80% for continuous 5 minutes or more then you have to identify CPU bottleneck also keep in mind that spikes above 80% for short period of time is normal and can be ignored.
This counter is available under Process.
Total Server Memory (KB)
You can define it as total amount of dynamic memory the server is currently consuming. If SQL Server total memory is relatively high as compared to total physical memory in the server then you have to add more memory. But before coming to decision also check other related counters like target memory, buffer cache hit ratio, buffer page life expectancy, buffer free pages etc.
This counter is available under SQLServer:Memory Manager
Target Server Memory (KB)
This is ideal amount of memory the SQL Server is willing to consume. This value cannot exceed the maximum server memory settings. SQL Server Database Engine consumes as much memory as it requires while startup and if it is require more memory and physical memory is available then it consumes it and target memory increases without creating memory bottleneck. If relatively target memory is high as compared to total physical memory then you can add more physical memory but again you have to consider other counters like total memory, buffer cache hit ratio, buffer page life expectancy, buffer free pages etc. before coming to conclusion.
This counter is available under SQLServer:Memory Manager
Lock Waits/sec
Number of lock requests that could not be satisfied immediately and required the caller to wait before being granted the lock. To improve the performance of database there should be less locks during transactions. You need to understand your database system and require continuous monitoring over the time and keep historical records for locks so that you can compare it with baseline to determine normal value of locks. If lock waits/sec is increasing then it is pointing to resource contention and you need to review number of concurrent connection, indexing etc. Also check buffer cache hit ratio, avg. disk queue length. If you are getting more than zero value then it is pointing to some sort of blocking is happening.
This counter is available under SQLServer:Locks
Average Wait Time (ms)
It can be defined as the average amount of wait time (milliseconds) for each lock request that resulted in a wait. To restrict simultaneous access on resources by another transactions locks are used. If a transaction holds an exclusive lock then other transaction cannot access it until it is released. To improve the performance of SQL Server you need minimum number of locks. Average wait times of above 500 ms indicating excessive blocking and you need to keep an eye on it and investigate the actual cause. You can also refer the counters Lock wait/sec and Lock timeouts/sec to come to conclusion.
This counter is available under SQLServer:Locks
As there as hundreds of counters, you can go through all the performance monitor counters as these are very useful and important for database server monitoring and performance tuning.
Now after adding required counters you can switch to Line graph, it will look like as given below.
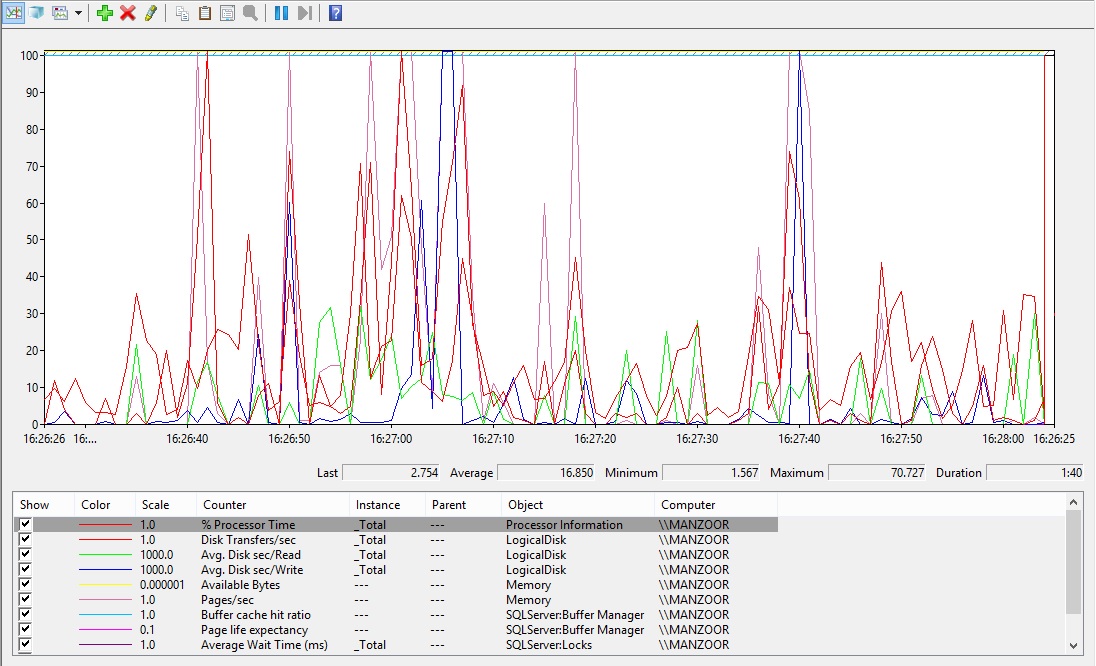
Figure 4: Line Graph
To refresh the counters values, you can right click and select Clear. If you want to remove the particular counter, you can go to Add Counters list and remove it or you can directly delete it by selecting it and press delete button on keyboard.
Note: Above given counter values are my personal experience and it may differ in other environments, also few definitions of counters have been referred from description field of add counters page.
CLICK HERE to watch live practical.
Reference: Manzoor Siddiqui [www.SQLServerLog.com]
You may also like